Try the new CSRC.nist.gov and let us know what you think!
(Note: Beta site content may not be complete.)

Interactions Involved in Software Failures - empirical data
One of the most important questions in software testing is "how much is enough"? For combinatorial testing, this question includes determining the appropriate level of interaction that should be tested. That is, if some failure is triggered only by an unusual combination of more than two values, how many testing combinations are enough to detect all errors? What degree of interaction occurs in real system failures?
If you have have questions, or would like to contribute data to this collection, please email me at kuhn@nist.gov.
Failure data: The table below summarizes what we know from empirical studies from a variety of application domains, showing the percentage of failures that are induced by the interaction of one to six variables. For example, 66% of the medical device failures were triggered by a single variable value, and 97% were triggered by either one or two variables interacting. Although certainly not conclusive, the available data suggest that the number of interactions invovled in system failures is relatively low, with a maximum from 4 to 6 in the six studies cited below. (Note: TCAS study used seeded errors, all others are "naturally occuring".) These results can be summarized in what we call the Interaction Rule: Most failures are induced by single factor faults or by the joint combinatorial effect (interaction) of two factors, with progressively fewer failures induced by interactions between three or more factors.
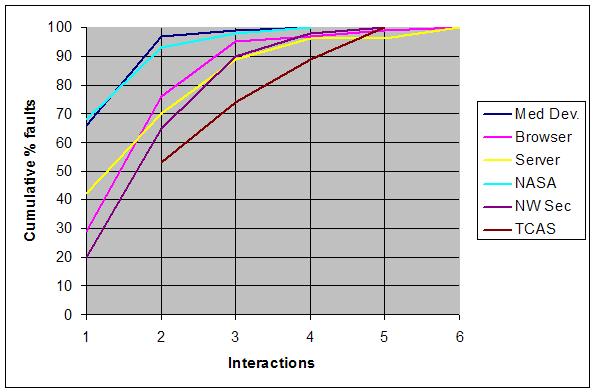
Fig. 1. Number of variables involved in triggering software faults
| Table 1. Number of variables involved in triggering software faults | ||||||
|---|---|---|---|---|---|---|
| Vars | Medical Devices |
Browser | Server | NASA GSFC |
Network Security |
TCAS |
| 1 | 66 | 29 | 42 | 68 | 20 | * |
| 2 | 97 | 76 | 70 | 93 | 65 | 53 |
| 3 | 99 | 95 | 89 | 98 | 90 | 74 |
| 4 | 100 | 97 | 96 | 100 | 98 | 89 |
| 5 | 99 | 96 | 100 | 100 | ||
| 6 | 100 | 100 |
Static analysis data: Why do the fault detection curves look this way? That is, why does the error rate tail off so rapidly with more variables interacting? One possibility is that there are simply few complex interactions in branching points in software. If few branches involve 4-way, 5-way, or 6-way interactions among variables, then this degree of interaction could be rare for faults as well. The table below (Table 2 and Fig. 2) gives the number and percentage of branches in avionics code triggered by one to 19 variables. I developed this distribution from Chilenski's report on the use of MCDC testing in avionics software, which contains 20,256 logic expressions in five different airborne systems in two different airplane models. The table below includes all 7,685 expressions from if and while statements; expressions from assignment (:=) statements were excluded.
| Table 2. Number of variables in avionics software branches | |||
|---|---|---|---|
| Vars | Count | Percent | Cumulative |
| 1 | 5691 | 74.1% | 74.1% |
| 2 | 1509 | 19.6% | 93.7% |
| 3 | 344 | 4.5% | 98.2% |
| 4 | 91 | 1.2% | 99.3% |
| 5 | 23 | 0.3% | 99.6% |
| 6 | 8 | 0.1% | 99.8% |
| 7 | 6 | 0.1% | 99.8% |
| 8 | 8 | 0.1% | 99.9% |
| 9 | 3 | 0.0% | 100.0% |
| 15 | 1 | 0.0% | 100.0% |
| 19 | 1 | 0.0% | 100.0% |
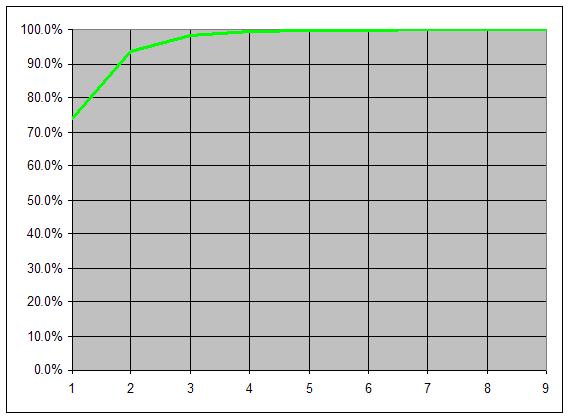 Fig. 2 Number of variables in avionics software branches
As shown in Fig. 2, most branching statement expressions are simple, with over 70% containing only a single variable. Superimposing the curve from Fig. 2 on Fig. 1, we see (Fig. 3) that most faults are triggered by more complex interactions among variables. It is interesting that the NASA distributed database faults, from development-phase software bug reports, have a distribution similar to expressions in branching statements. This may be accounted for by the fact that this was development-phase rather than fielded software like all other types reported in Fig. 1. As faults are removed, the remaining faults may be harder to find because they require the interaction of more variables. Thus testing and use may push the curve down and to the right.
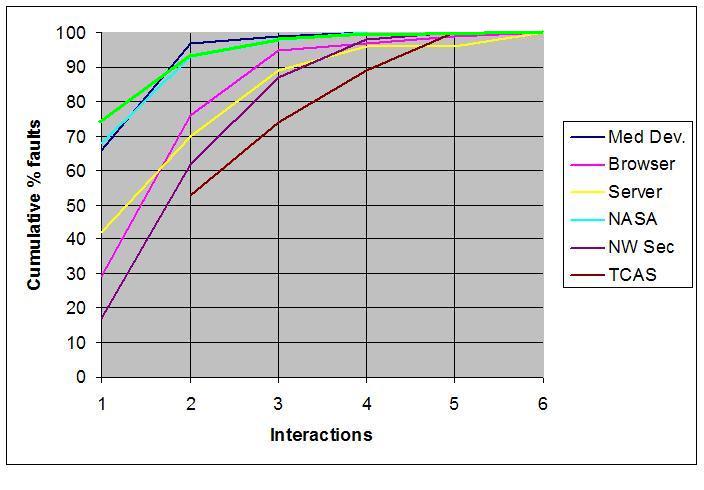 Fig. 3 Software faults vs. software branches
Narrow software domains: We have investigated a particular class of vulnerabilities, denial-of-serivce, using reports from the National Vulnerability Database (NVD), a repository of data on all publicly reported software security vulnerabilities. NVD can be queried for fine-granularity reports on vulnerabilities. Data from 3,045 denial-of-service vulnerabilities have the distribution shown below.
| Vars | NVD Cumulative % |
| 1 | 93% |
| 2 | 99% |
| 3 | 100% |
| 4 | 100% |
| 5 | 100% |
| 6 | 100% |
Analyzing failure data: Our Summer Undergraduate Research Fellowship student Menal Modha has prepared a short tutorial on analyzing failure reports to determine the degree of variable interaction in failures. The NVD data sets wre analyzed by Evan Hartig, Bryan Wilkinson, and Menal Modha, and are available here:
NVD:
NVD 2006 denial-of-service vulnerability data
NVD 2007 denial-of-service vulnerability data
Network Security:
Bell dissertation data
Combinatorial vs. exhaustive testing: The studies cited below compare combinatorial methods with exhaustive (with respect to discretized values) testing, showing combinatorial testing produced equivalent results with only a small fraction of the tests required for exhaustive:
Giannakopoulou et al. (2011) compared various code coverage metrics using combinatorial and exahustive testing. Coverage was nearly identical and authors reported that only one segment of code was missed by 3-way testing, because it required a specific combination of four variables that would have been caught with a 4-way covering array.
| Test set | No. of tests | Stmt% | Branch% | Loop% | Condition% |
| Exhaustive | 9.9 x 10⁶ | 94/94 | 90/92 | 46/37 | 85/83 |
| 3-way | 6,047 | 93/94 | 89/91 | 46/37 | 83/81 |
Montanez et al. (2011) compared combinatorial and exhaustive test sets for conformance testing of the W3C Document Object Model. A 4-way test suite found all faults discovered by exhaustive testing with less than 5% of the number of tests.
| t | Tests | % of Original | Test Results Pass Fail |
|
| 2 | 702 | 1.92% | 202 | 27 |
| 3 | 1342 | 3.67% | 786 | 24 |
| 4 | 1818 | 4.96% | 437 | 72 |
| 5 | 2742 | 7.49% | 908 | 72 |
| 6 | 4227 | 11.54% | 1803 | 72 |
References
Medical Devices: D.R. Wallace, D.R. Kuhn, Failure Modes in Medical Device Software: an Analysis of 15 Years of Recall Data, International Journal of Reliability, Quality, and Safety Engineering, Vol. 8, No. 4, 2001.D.R. Kuhn and M.J. Reilly, An Investigation of the Applicability of Design of Experiments to Software Testing, 27th Annual NASA Goddard/IEEE Software Engineering Workshop (SEW '02), Greenbelt, Maryland, December 5-6, 2002, pp. 91-95.
Abstract; DOI: 10.1109/SEW.2002.1199454; Preprint
Comment: Investigates interaction level required to trigger faults in open source browser and server.
Browser, Server:
NASA database: D.R. Kuhn, D.R. Wallace, A.J. Gallo, Jr., Software Fault Interactions and Implications for Software Testing, IEEE Trans. on Software Engineering, vol. 30, no. 6, June, 2004.
Network Security: K.Z. Bell, Optimizing Effectiveness and Efficiency of Software Testing: a Hybrid Approach, PhD Dissertation, North Carolina State University, 2006.
TCAS module: D. R. Kuhn, V. Okun, Pseudo-exhaustive Testing for Software, 30th Annual IEEE/NASA Software Engineering Workshop (SEW-30), Columbia, Maryland, April 24-28, 2006, pp. 153-158.
Abstract; DOI: 10.1109/SEW.2006.26; Preprint
Avionics software branches: J. J. Chilenski, An Investigation of Three Forms of the Modified Condition Decision Coverage (MCDC) Criterion, Report DOT/FAA/AR-01/18, April 2001, 214 pp.
D. Giannakopoulou, D.H. Bushnell, J. Schumann, H. Erzberger, K. Heere, "Formal Testing for Separation Assurance", Ann. Math. Artif. Intell., 2011. DOI: 10.1007/s10472-011-9224-3 (abstract)
C. Montanez, D.R. Kuhn, M. Brady, R. Rivello, J. Reyes, M.K. Powers, "An Application of Combinatorial Methods to Conformance Testing for Document Object Model Events", NIST-IR 7773. 25 Jan 2011.